
For research use only. Not for human consumption, diagnostic, or therapeutic use.
Calculating ROI for Individual Marketing Channels
Formula recap: ROI = (Net Profit ÷ Total Investment) × 100 %. This simple ratio tells you how many cents you earn for every dollar spent on a specific channel. Keep the calculation consistent across email, social, webinars, and e‑commerce so you can compare apples to apples.
Email Campaign Example
Suppose you run a targeted email blast to a list of 5,000 clinic owners. The platform fee for the month is $250, and you pay a freelance copywriter $150 for creative assets. Total investment = $400.
The campaign generates 30 sales, each delivering a net profit of $45 after product cost and fulfillment. Revenue‑derived profit = 30 × $45 = $1,350. ROI = ($1,350 ÷ $400) × 100 % ≈ 337 %. This tells you that every dollar spent on email returns more than three dollars in profit.
Social Media Ads Example
Imagine you allocate $800 to Facebook and Instagram ads. Your cost‑per‑click (CPC) averages $0.80, resulting in 1,000 clicks. With a 4 % conversion rate, you secure 40 purchases. Each purchase yields $55 net profit, so total profit = 40 × $55 = $2,200.
ROI = ($2,200 ÷ $800) × 100 % ≈ 275 %. To refine this further, apply the platform’s attribution window (e.g., 7‑day click‑through) so you only count conversions that truly originated from the ad spend.
Webinar Example
You host a live webinar costing $300 for the hosting platform and $200 for speaker fees, plus $100 in promotional spend. Total investment = $600.
The event attracts 150 registrants, of which 45 attend. Post‑webinar surveys show a 20 % upsell rate, meaning 9 attendees purchase a peptide bundle worth $120 net profit each. Upsell profit = 9 × $120 = $1,080.
ROI = ($1,080 ÷ $600) × 100 % ≈ 180 %. Webinars often have a longer sales cycle, so consider tracking follow‑up email conversions for an even more accurate picture.
E‑commerce Channel Example
Your online store spends $1,200 on Google Shopping ads. The average order value (AOV) for peptide kits is $150, and the net profit after product and fulfillment costs is $70 per order.
Ad performance yields 15 purchases, so profit = 15 × $70 = $1,050. ROI = ($1,050 ÷ $1,200) × 100 % ≈ 87.5 %. If you add a 10 % discount code exclusive to ad clicks, adjust the net profit accordingly before finalizing the ROI.
Tips for Handling Multi‑Touch Attribution in Peptide Sales Cycles
Peptide purchases often involve several touchpoints—an email introduces the brand, a social ad reinforces the message, a webinar deepens education, and the e‑commerce site closes the sale. To avoid double‑counting, assign a weighted value to each interaction (e.g., 30 % email, 25 % social, 25 % webinar, 20 % e‑commerce) based on the typical path observed in your CRM.
Use first‑touch, last‑touch, and linear attribution models side‑by‑side. Compare results to see which model aligns best with your internal sales funnel. Adjust channel budgets gradually, favoring the model that reflects true contribution.
Visualizing Contributions with a Multi‑Channel Funnel
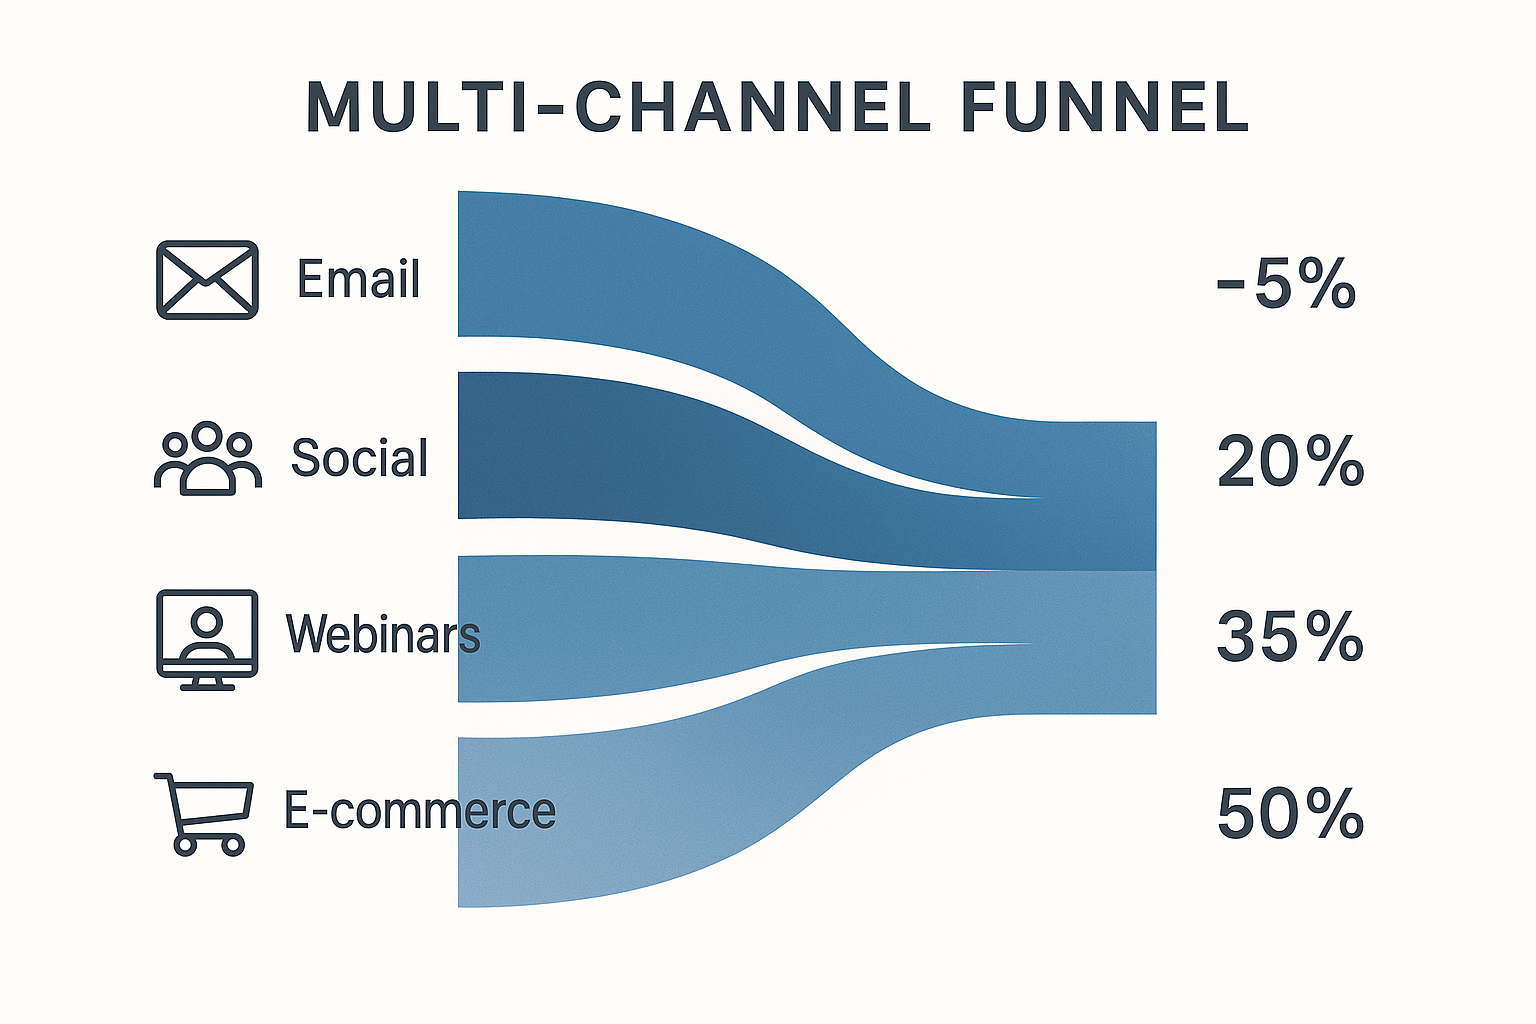
The multi‑channel funnel diagram translates the weighted attribution into a clear visual. Each stage—Awareness (email/social), Consideration (webinar), Decision (e‑commerce)—is represented by a proportional bar. This graphic helps stakeholders quickly grasp where the highest ROI originates and where optimization opportunities lie.
When you overlay the ROI percentages calculated above onto the funnel, patterns emerge: email may deliver the highest percentage return, but social ads could drive the greatest volume of leads. Balancing high‑ROI, low‑volume channels with high‑volume, moderate‑ROI channels creates a sustainable growth engine for your peptide brand.
Aggregating Channel ROI into an Overall Performance Score
1. Aligning Channel Weightings with Business Objectives
Before you blend the ROI figures from paid search, email, social, and in‑clinic referrals, decide which outcomes matter most to your practice. If your primary goal is to acquire new research subjects for a newly launched peptide line, you might assign a higher weight to acquisition‑focused channels such as Google Ads or influencer collaborations. Conversely, a clinic that already enjoys a robust research subjects base may prioritize retention‑driven channels—loyalty emails, SMS reminders, and post‑visit follow‑ups.
Typical weighting schemes look like this:
- Acquisition‑heavy strategy: Paid search 30%, Influencer 25%, Social paid 20%, Email nurture 15%, In‑clinic referrals 10%.
- Retention‑heavy strategy: Email nurture 30%, SMS reminders 25%, Loyalty program 20%, Paid search 15%, Influencer 10%.
Adjust the percentages until the sum equals 100 %. The resulting distribution becomes the lens through which you view each channel’s contribution to the overall ROI.
2. Computing a Weighted Average ROI
The weighted average ROI is a single figure that reflects both performance and strategic importance. Use the following formula:
Overall ROI = Σ (Channel ROI × Channel Weight) ÷ 100
For example, imagine a clinic with the following data (weights based on an acquisition focus):
| Channel | ROI (%) | Weight (%) |
|---|---|---|
| Paid Search | 45 | 30 |
| Influencer | 38 | 25 |
| Social Paid | 28 | 20 |
| Email Nurture | 22 | 15 |
| In‑Clinic Referrals | 55 | 10 |
Plugging the numbers into the formula yields an overall ROI of 37 %—a concise, strategy‑aligned performance score you can track month over month.
3. Visualizing the Composite Score in a Dashboard
A clear visual dashboard turns raw numbers into actionable insight. Both Google Data Studio and Excel can deliver a lightweight, shareable view.
- Google Data Studio: Connect your analytics sources (Google Ads, Mailchimp, CRM) via connectors, create a calculated field for the weighted ROI, and display it as a gauge or scorecard. Add a time‑series chart to watch trends and a bar chart that breaks down each channel’s weighted contribution.
- Excel: Build a table with channel ROI, weight, and the product of both. Use
=SUMPRODUCT(ROI_range,Weight_range)/100for the overall figure. Insert a Combo Chart—bars for individual weighted contributions, a line for the cumulative score.
Key dashboard elements:
- Overall weighted ROI (large, central metric).
- Channel‑level weighted ROI bars for quick comparison.
- Target benchmark line (e.g., 30 % for healthy peptide businesses).
- Month‑over‑month delta to surface sudden shifts.
4. What a Healthy Overall ROI Looks Like in Peptide Marketing
Industry data suggests that a well‑run peptide clinic should aim for a weighted ROI of 30 %–40 % after accounting for product cost, shipping, and compliance overhead. Scores below 20 % often signal pricing pressure, high acquisition cost, or inefficient follow‑up sequences. Scores above 45 % are rare and usually indicate a highly optimized funnel with strong repeat‑purchase rates.
Use the benchmark as a decision threshold: if your overall score consistently trails the 30 % mark, it’s time to revisit channel weightings, creative assets, or the underlying offer.
5. Spotting Weak Links and Rebalancing Budgets
The dashboard makes under‑performing channels obvious. Look for any channel where the weighted contribution drags the overall score down—typically a low ROI paired with a high weight. Follow a three‑step remediation process:
- Diagnose: Drill into the channel’s cost‑per‑acquisition (CPA) and conversion funnel. Are ads targeting the wrong demographic? Is email content failing to trigger a purchase?
- Test: Run A/B experiments on ad copy, landing‑page layouts, or email subject lines. Allocate a small test budget (5‑10 % of the channel spend) to validate improvements.
- Reallocate: Once a new creative or targeting rule proves profitable, shift a portion of the under‑performing channel’s weight to the higher‑yielding one. Update the weighting percentages in your calculation and watch the overall ROI climb.
6. Case Study: Turning a Multi‑Location Clinic’s ROI Around
Background: A chain of five wellness clinics launched a peptide supplement line and initially spread its marketing budget evenly across paid search, Instagram ads, email newsletters, and in‑clinic flyers. The weighted ROI sat at 22 %—well below the 30 % benchmark.
Optimization steps:
- Re‑weighted the mix to reflect an acquisition focus: Paid search 35%, Instagram 30%, Email 20%, In‑clinic 15%.
- Implemented a weighted ROI calculator in Google Data Studio, exposing a clear dip in Instagram performance (ROI 12 %).
- Paused 60 % of Instagram spend, redirected those dollars to a refined Google Ads campaign targeting high‑intent keywords.
- Enhanced email nurture with a 3‑step educational series on peptide safety, boosting email ROI from 18 % to 29 %.
Result: After a 90‑day cycle, the overall weighted ROI rose to 30 %, a 35 % improvement over the baseline. The clinic also observed a 20 % increase in repeat purchases, confirming that the reallocation not only lifted short‑term profitability but also strengthened long‑term research subjects loyalty.
This example illustrates how a disciplined weighting framework, combined with a transparent dashboard, can turn scattered channel data into a single, strategic performance score—and ultimately drive measurable growth for peptide‑focused businesses.
Tools, Automation, and Best Practices for Ongoing ROI Tracking
Analytics Platforms that Speak Peptide E‑Commerce
Three platforms dominate the analytics landscape for peptide retailers:
- Google Analytics 4 (GA4) – Offers event‑based tracking that captures every product view, add‑to‑cart, and checkout step. By mapping GA4 events to SKU IDs, you can attribute revenue to specific peptide formulations and instantly see which campaigns are driving the highest cost‑per‑acquisition (CPA).
- HubSpot – Combines CRM data with marketing attribution. When a clinic’s practitioner logs a purchase in HubSpot, the platform enriches the record with source‑medium data, letting you calculate lifetime value (LTV) per acquisition channel without leaving the sales pipeline.
- Klaviyo – Tailored for e‑mail and SMS flows, Klaviyo’s built‑in revenue tracking tags each message with the exact peptide SKU sold after a click. This granularity is essential for measuring the ROI of nurture sequences that promote new research‑use‑only (RUO) releases.
All three tools support native integrations with Shopify, WooCommerce, and custom storefronts, meaning data flows in real time without manual CSV imports.
Automation Strategies to Eliminate Manual Pulls
Even the most powerful analytics suite becomes cumbersome if you’re constantly downloading reports. The following automation tactics keep ROI data fresh and hands‑free:
- Webhook‑driven data pulls – Configure your e‑commerce platform to fire a webhook each time an order is fulfilled. The payload can be sent directly to a Google Sheet or a BigQuery table, where a pre‑built script calculates gross margin, ad spend, and net profit.
- Scheduled spreadsheet updates – Use Google Apps Script or Microsoft Power Automate to run a nightly job that queries the GA4 API, HubSpot API, and Klaviyo API. The script appends the latest metrics to a master “ROI Dashboard” sheet, guaranteeing a single source of truth for daily reviews.
- API connections to ad platforms – Pull spend, impressions, and click‑through data from Google Ads, Meta Ads, and TikTok via their REST APIs. By joining ad spend tables with order tables on
transaction_id, you can instantly compute return on ad spend (ROAS) for each peptide line.
These automations reduce manual effort by up to 80 % and free up time for strategic analysis rather than data wrangling.
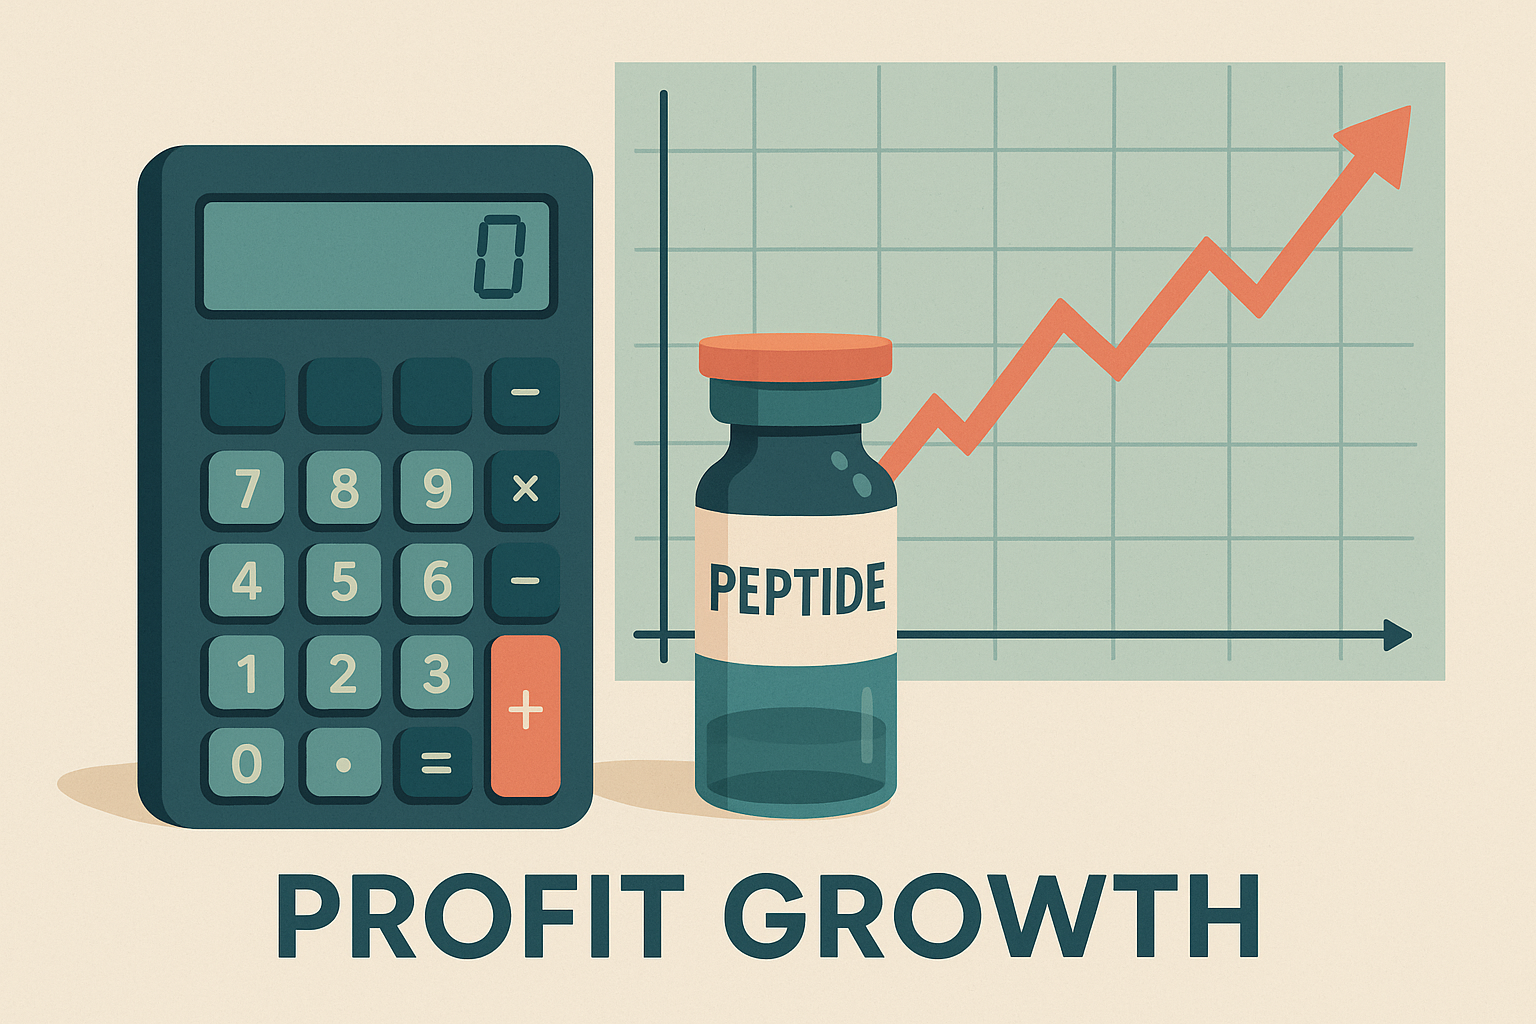
Visualizing Profit Growth with the Calculator‑and‑Vial Model
The “calculator‑and‑vial” illustration is a simple metaphor that translates raw numbers into a visual growth story. Picture a vial representing a peptide batch; each drop added to the vial corresponds to a profit increment calculated by the ROI formula:
Profit = (Revenue – Cost of Goods – Ad Spend) × (1 + Growth Rate)
By feeding the calculator with real‑time data from the automated sheets, the vial fills up automatically. When the vial reaches a predefined threshold, it signals that the current channel is delivering sustainable profit, prompting you to scale spend. Conversely, a shrinking vial warns you to pause or optimize the underperforming campaign.
Best‑Practice Checklist for Continuous ROI Accuracy
- Data hygiene – De‑duplicate transaction IDs, validate SKU mappings, and reconcile currency conversions nightly.
- Regular audit cycles – Conduct a quarterly audit of all API credentials, webhook endpoints, and attribution windows to ensure no data gaps.
- Compliance flagging – Tag any spend linked to promotional claims that could trigger FDA scrutiny. Automated alerts can route these flags to your compliance officer before the spend is booked.
- Version‑controlled dashboards – Store dashboard definitions in a Git repository so you can roll back to a known‑good state if a metric suddenly spikes.
- Performance thresholds – Set minimum ROAS (e.g., 4:1) and maximum CPA benchmarks. Use conditional formatting in your spreadsheet to highlight breaches instantly.
How YourPeptideBrand’s White‑Label Suite Simplifies Cost Tracking
YourPeptideBrand (YPB) embeds cost transparency into every order line. When a clinic purchases a peptide batch through YPB’s dropshipping portal, the invoice automatically includes:
- Base manufacturing cost per vial
- Label‑printing and custom‑packaging fees
- Drop‑shipping logistics surcharge
- Any promotional discount applied at checkout
These line‑item details are exported via YPB’s API directly into your GA4‑linked data lake. The result is a single report where ad spend, product cost, and fulfillment fees sit side‑by‑side, allowing you to calculate true net profit per channel without manual reconciliation.
By pairing YPB’s white‑label cost feed with the automation workflow described above, you achieve a “set‑and‑forget” ROI engine that updates every hour, flags compliance risks, and visualizes profit growth with the calculator‑and‑vial model—all while keeping your focus on research subjects outcomes and clinic expansion.
Wrap‑Up and Next Steps for Maximizing Peptide Marketing ROI
ROI Calculation Workflow at a Glance
Throughout this guide we walked you through a repeatable workflow: define measurable metrics, capture cost and revenue data, apply the ROI formula, and visualize the results on a live dashboard. By aligning each channel—paid ads, email nurture, affiliate referrals, and direct sales—with a consistent tracking schema, you gain a single source of truth for performance.
- Metric selection: Identify cost per acquisition, average order value, and repeat‑purchase rate for every touchpoint.
- Data capture: Use UTM parameters, pixel events, and inventory logs to feed accurate numbers into your analytics platform.
- ROI formula: Apply (Revenue – Cost) ÷ Cost × 100 to each campaign and aggregate results weekly.
- Dashboard integration: Plot trends in a visual board that flags under‑performing assets in real time.
- Iterative testing: Adjust creatives, budgets, or pricing, then re‑measure to confirm lift.
Continuous Improvement & Compliance Alignment
Peptide marketing operates under strict FDA Research Use Only guidelines, so your ROI engine must respect both profitability and regulatory boundaries. Treat compliance as a KPI itself—track labeling accuracy, batch traceability, and documentation audit trails alongside financial metrics. A disciplined, data‑driven loop lets you fine‑tune ad spend while staying within permissible claim limits, ensuring that every dollar invested also safeguards your brand’s credibility.
Partnering with YourPeptideBrand
When you choose YPB, the guesswork disappears. Our turnkey white‑label platform handles label printing, custom packaging, and dropshipping without minimum orders, freeing you to focus on growth rather than logistics. We embed cost‑tracking hooks directly into the fulfillment workflow, so each shipment automatically updates your ROI dashboard. This seamless integration accelerates scaling while keeping compliance documentation up to date.
Ready to move from theory to a profitable launch? Visit YourPeptideBrand.com and download our free ROI Assessment Guide. The guide walks you through a quick self‑audit, highlights hidden cost drivers, and outlines the next steps for a data‑backed, compliant peptide brand rollout.